Charts
With all your data centralized in Boost.space you can create charts and dashboards to get custom insights.
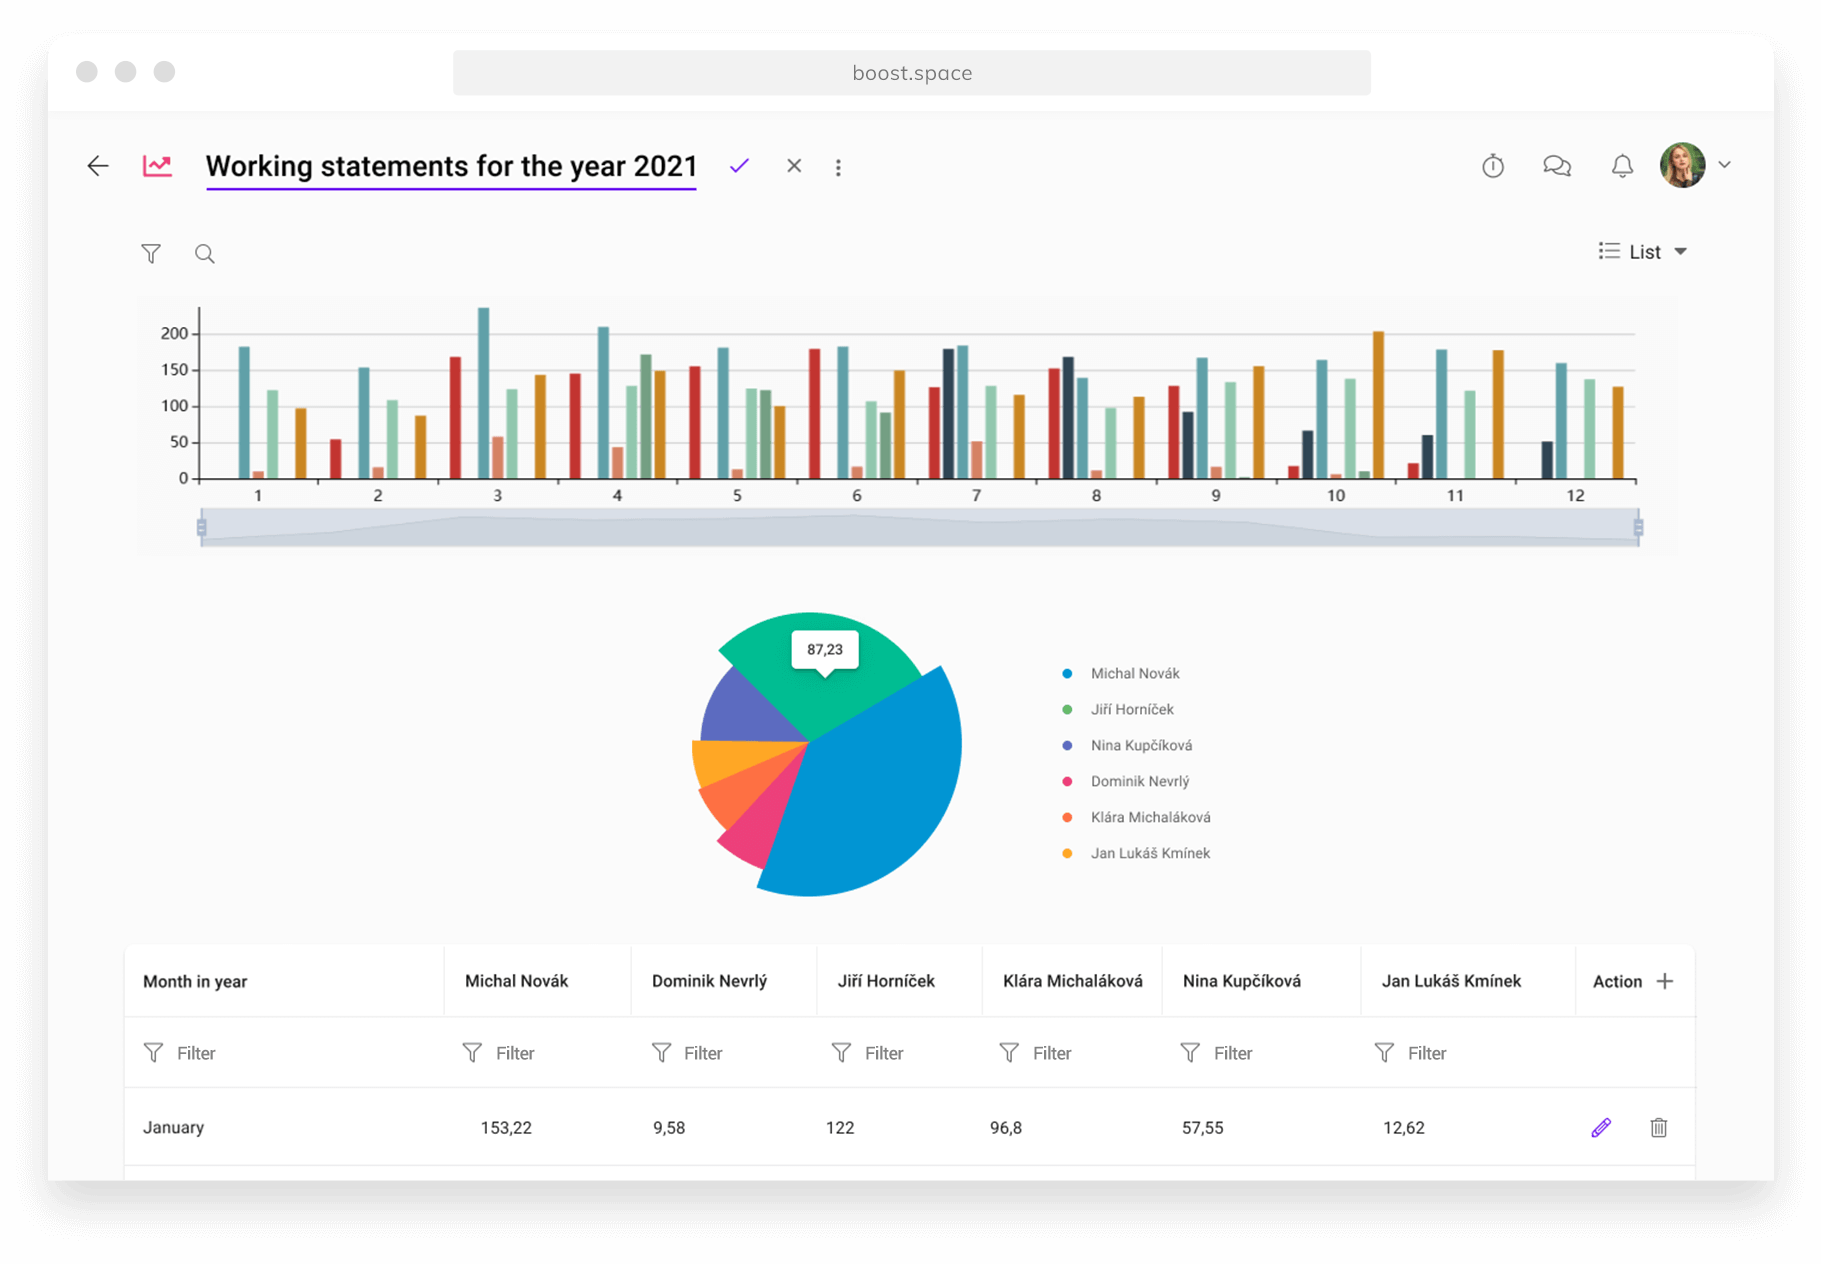
Turn data into information in the best way possible. Use dozens of advanced charts to present company data from internal and external sources and make data-based decisions.
Discover the strengths and weaknesses of the company
Compare the data from marketing with actual revenues and numbers from the accounting program with information from the CRM system. Find out your real expenses on every contract and reveal the weaknesses of your company.
Report and present the company data
Transform your graphs into a presentation and share them with employees, investors, partners, or clients.
Make decisions based on facts
You can use a vast number of charts to analyze your data – from simple to very complex ones. To analyze your data, you can use, for example, a point box, or layered circle chart.